On the homepage, click Sign Up → (top-right) — or just click ⚡ Open Screener or 📋 Open Journal, which takes you to sign-up automatically if you're not logged in yet. Enter your email and a password (min 6 characters), confirm it, and hit Create Free Account — or skip the form entirely with Sign up with Google. Already have an account? Use Sign In instead.
TradeWithTech sends a verification link to the email you signed up with. Open that email, click the link, then come back to the app and press I've verified — Continue. Didn't get the email? Use Resend verification email on the same screen. Signed up with the wrong address? Use Sign out and start over.
Once verified, click Market Analysis in the top navigation — that's the same Screener you saw on the homepage, just relabelled once you're logged in. This opens the Hub, a Market Pulse dashboard rather than the filter screen directly: stocks tracked and data-as-of date, your saved presets, a market breadth strip (Advancers/Decliners, % above 50 & 200 EMA), and Movers cards — 52W High/Low, Volume Shockers, Circuit Hits, Corporate Actions, and Top/Worst Sector — plus a Result Calendar and quick links to Market Breadth, RS Dashboard, Help, and Updates. Click Need more filters? Click here → to open the full filter screener.
Click your avatar (top-right) to open your Profile. Under Account Details, set a username and add a short bio. Check the Subscription card — once your email is verified, you can Start 14-Day Free Trial to unlock Pro features, or upgrade directly. The Your Activity card (most visited page, most used filter, presets saved) fills in automatically as you use the platform.
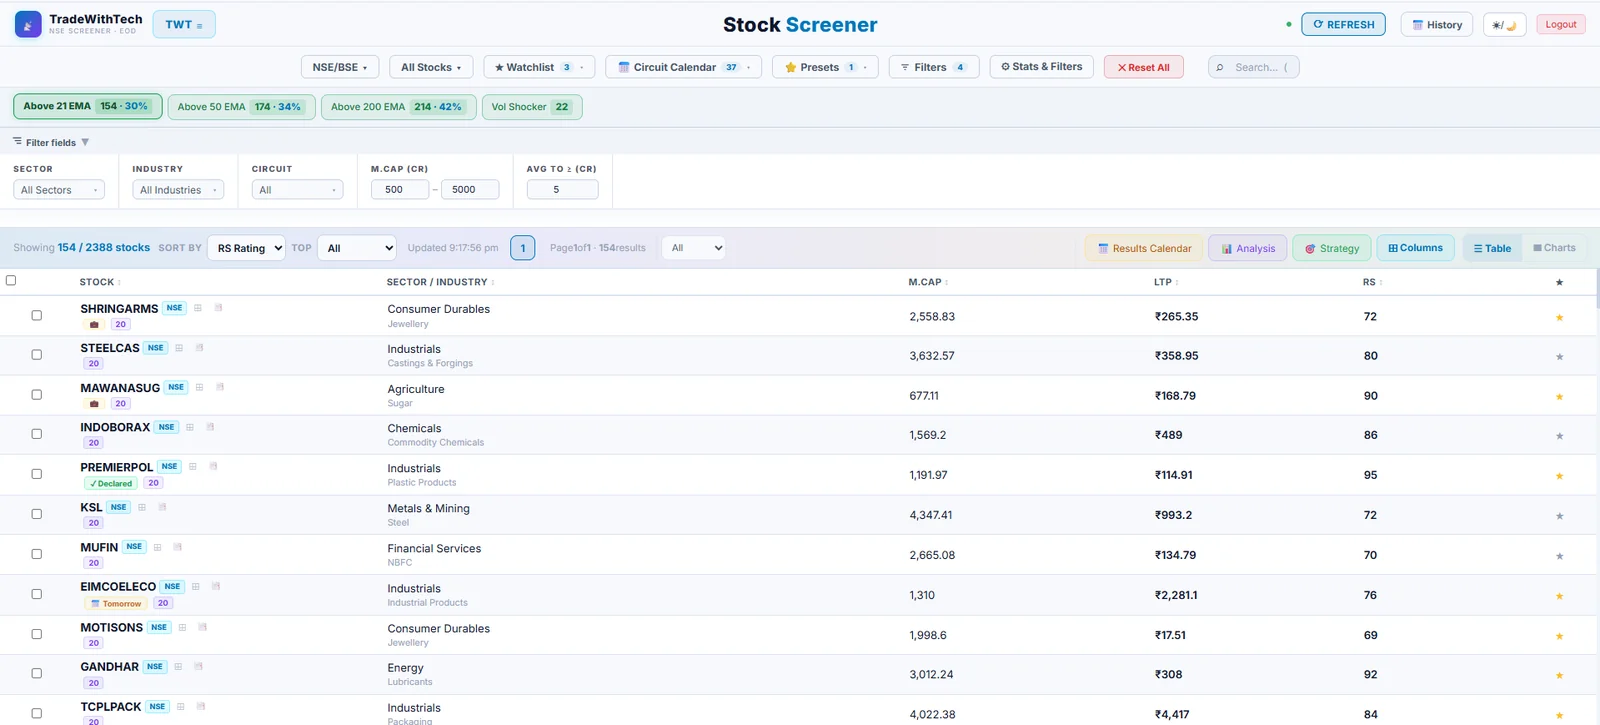
Use the sector filter at the top to narrow down to a specific segment, or leave it on "All" to scan the full market.
Set range filters for RS Rating, MSwing, CPR, price, volume, and more. Each filter updates the result count instantly.
Click any column header to sort. Hover over a stock name to see its chart right there, without leaving the list.
Select stocks using checkboxes, then hit "Copy TV" to copy them in NSE:SYMBOL format — paste directly into TradingView's watchlist.
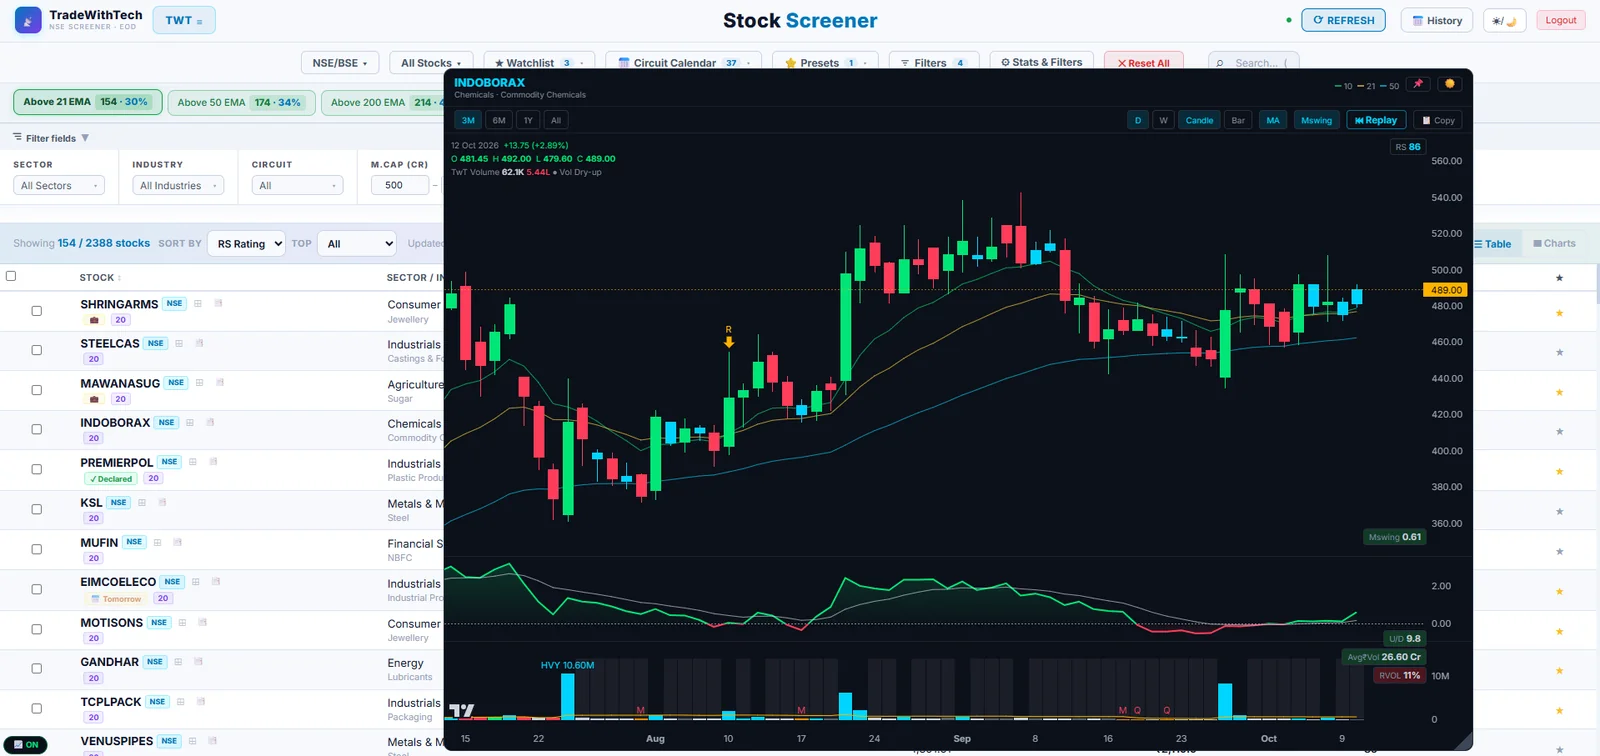
Beyond Filters and Presets (covered separately below), the toolbar above the table has a few more controls:
On the Hub page, a sticky sidebar panel lists which companies are reporting results — switch between Yesterday / Today / Tomorrow tabs, with a running count of how many are reporting.
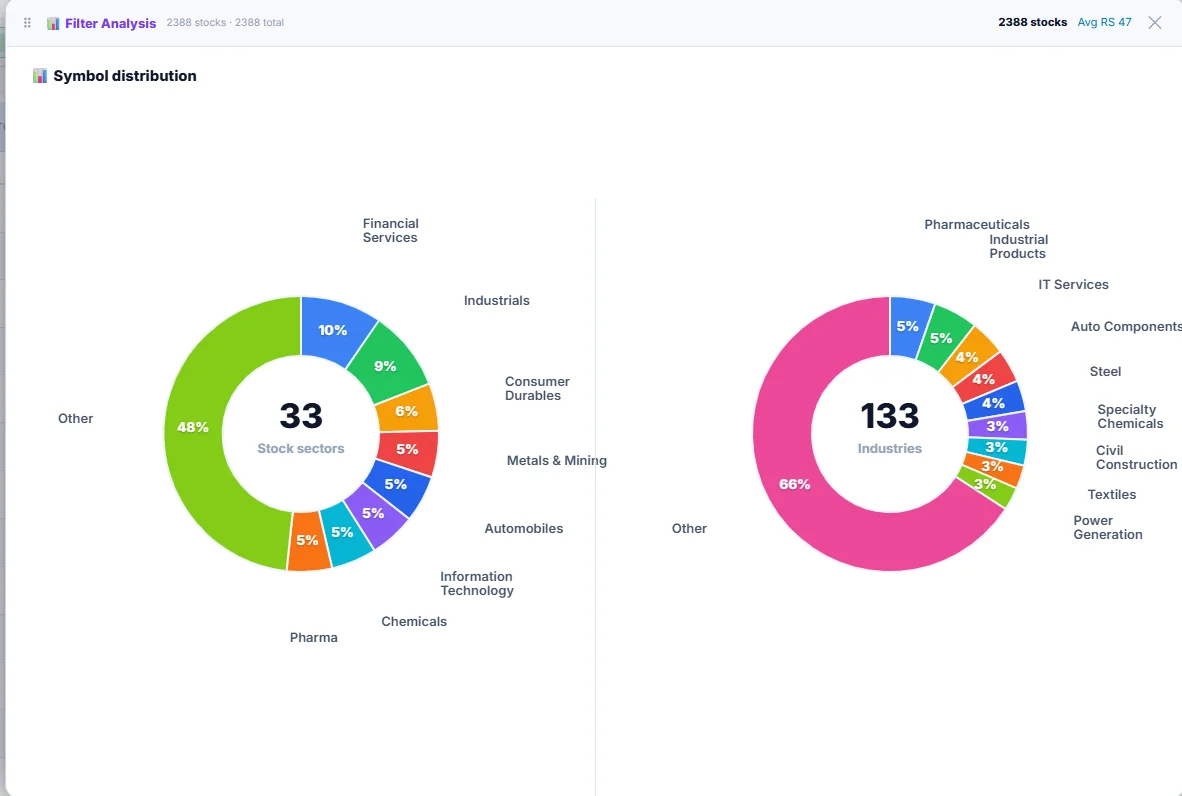
Click 📊 Analysis above the table to open a draggable panel that breaks down your currently filtered stocks by Sector and Industry side by side, with a filtered-count and average-RS readout in the header. If a structural signal like Gap, HLR, or MCP is active, a second "scan" view shows those stocks in a dedicated structured table instead.
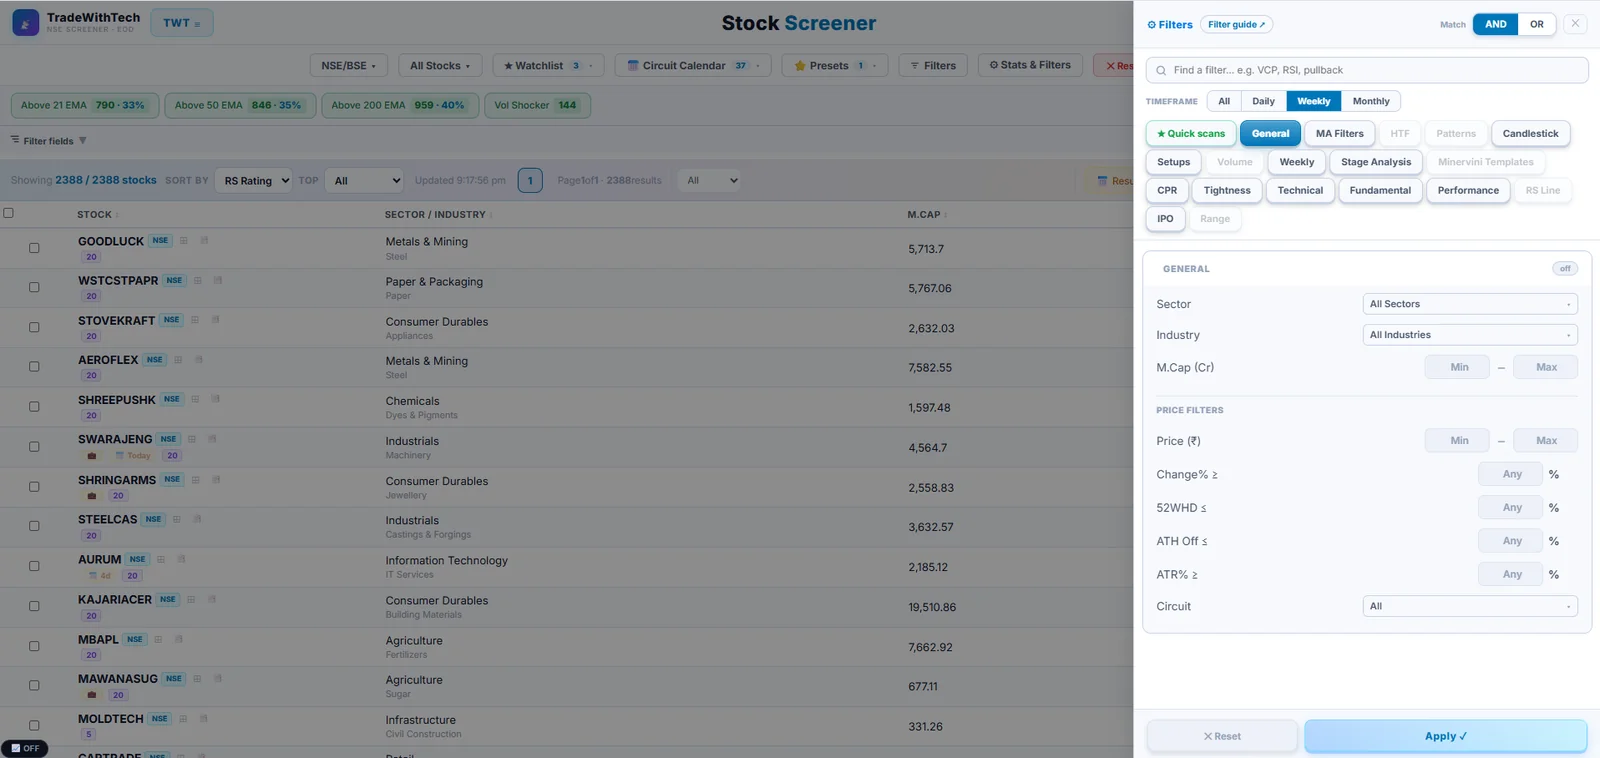
Click Filters to open the panel. At the top: Find a filter (type any name, e.g. "rsi" or "pullback"), the Timeframe switch (All / Daily / Weekly / Monthly — shows only that timeframe's filters), and the Active strip (every filter that is on; ✕ removes it). Below are 18 tabs; a number on a tab shows how many of its filters are on.
Two Pro-only ways to reshape the results table beyond filtering.
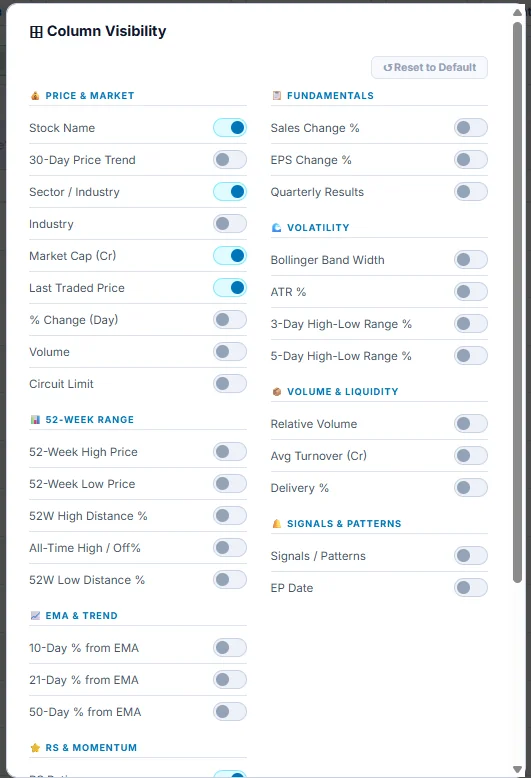
Click ⊞ Columns above the table to open the column picker — toggle any column on or off, and the table rebuilds instantly. Column visibility, like most view preferences, is saved for next time.
Next to the pager, use Sort By (RS Rating, MSwing, 1M/3M/6M/12M Perf) together with Top (All, 10, 25, 50, 100, or Custom…) to show only the top N stocks ranked by that metric — on top of whatever filters are already active.
Save your current filter combination — every setting across all tabs — as a named preset you can reload in one click.
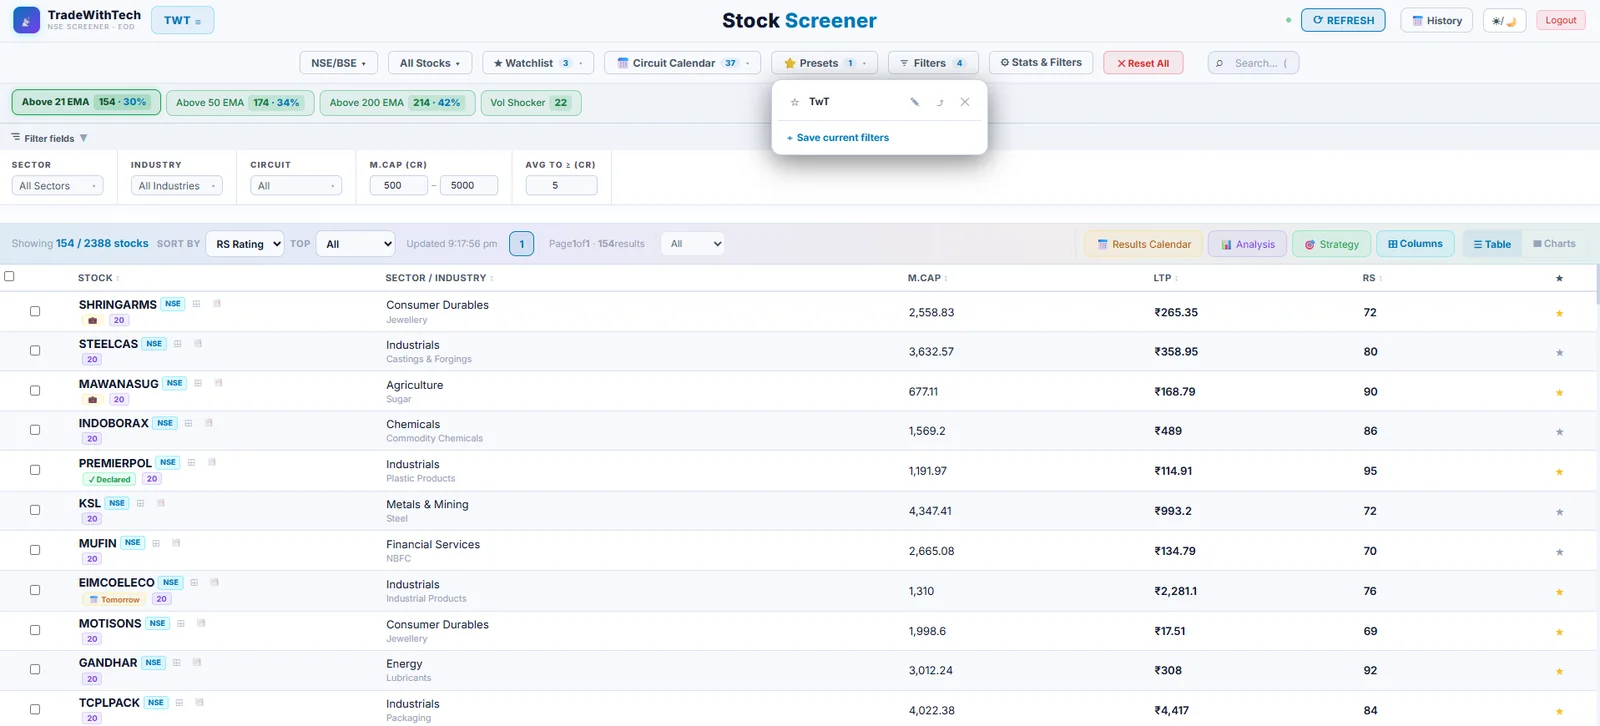
With filters applied, open ⭐ Presets in the toolbar and click + Save current filters (the same button is in the Filters panel's ★ Quick scans tab), then give it a name. It captures every active filter, tab by tab — not just a couple of fields.
Your saved presets are listed in the ⭐ Presets menu (the number shows how many you have), in the ★ Quick scans tab, and on the Hub page under "Your Saved Presets" — click one to re-apply that exact combination. Each preset has ✎ Rename, ⤴ Share (copies a link to it) and ✕ Delete.
Switch the results area from the data table to a grid of mini price charts — one per stock — so you can eyeball chart shape across your whole filtered list without opening each stock individually.
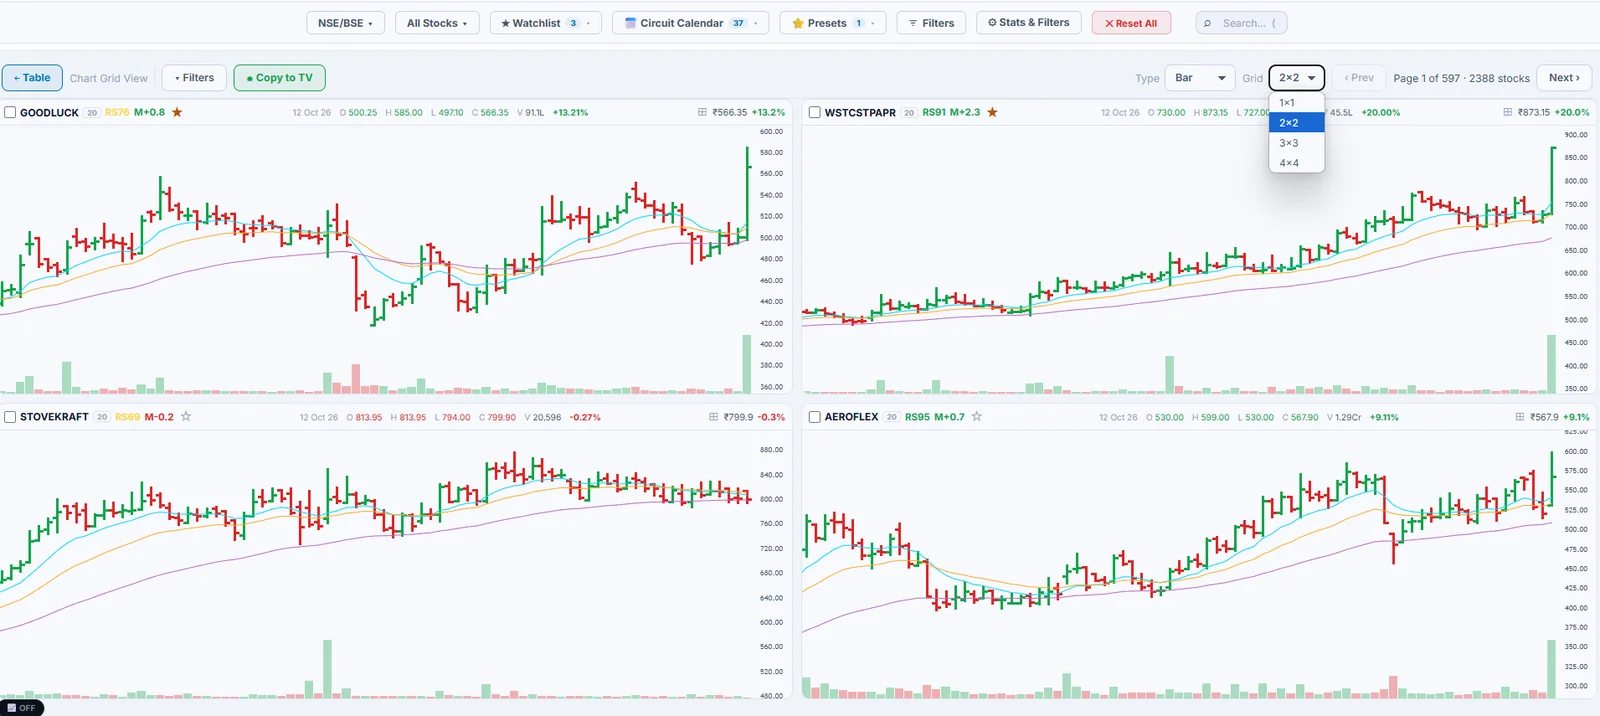
Above the results table, click ▦ Charts (next to ☰ Table) to switch. Click ← Table at any time to switch back — your filters carry over either way.
Use the Grid dropdown to choose 1×1, 2×2, 3×3 (default) or 4×4 charts per page, and Type to switch each mini-chart between Candle and Bar. Each card shows the stock's RS rating and MSwing value in its header — click a card to open the full chart.
Toggle ▾ Filters to show/hide the filter bar without leaving Chart View. Select stocks (a count badge appears) and use ⬥ Copy to TV to export them in NSE:SYMBOL format, same as the table view.

- Find a filter: type any part of a name ("rsi", "pullback", "mcap"). Pick a result and the right tab opens with the filter highlighted.
- Timeframe (All / Daily / Weekly / Monthly): changes only which filters are shown. A filter that is already set keeps working while hidden, and the tab says "N of them active".
- Active: one pill per filter that is on. Click a pill to jump to it, ✕ to remove it, Clear all to remove everything.
- AND / OR: applies to signal chips only. AND = a stock must have every chip you picked. OR = any one is enough. Number filters (RSI, MCap, Volume…) always apply together.
- Number on a tab: how many filters are on in that tab.
- Quick scans: six ready-made scans in one click, plus "+ Save current filters" to keep your own. Saved scans include Volume rules.
- Reset: turns every filter off.

| Filter | What it does |
|---|---|
| Sector / Industry | Pick one or more; only their stocks are shown. |
| M.Cap (Cr) | Market cap range in ₹ crore (min – max). |
| Price (₹) | Range for today's last price. |
| Change% ≥ | Today's move from yesterday's close, in %. |
| 52WHD ≤ | How far below the 52-week high. 10 = within 10% of the high. |
| ATH Off ≤ | How far below the all-time high, in %. 5 = within 5% of the ATH. |
| ATR% ≥ | Average daily move (14-day ATR) as % of price. Higher = more volatile. |
| Circuit | The stock's price band: 20% / 10% / 5% / 2%, or F&O stocks. |
Pick Daily / Weekly / Monthly at the top, then EMA or SMA. Each view has the same three kinds of filter.

| Filter | What it does |
|---|---|
| Price > N EMA | Today's close is above that moving average. |
| Price > all (full stack) | Close is above every MA. A new listing without a 200 EMA is checked on the MAs it has. |
| 10 > 21 EMA (MA vs MA) | The shorter MA is above the longer one: trend pointing up. |
| 10 > 21 > 50 > 200 (stack) | All MAs in order: the strongest uptrend shape. |
| N EMA within ≤ % | How far price is from that MA. 3 = within 3% of it (buying near the MA on a pullback). |
MAs available: daily 10 / 21 / 50 / 200, weekly 10 / 30 / 40 / 50, monthly 10 / 21.
High Tight Flag: a sharp rally (the pole), then a short, tight pause (the flag).

| Filter | What it does |
|---|---|
| HTF (Forming) | A big pole is in place and the flag is still forming; no breakout yet. |
| Mini HTF (Forming) | The same pattern with a smaller pole. |
| HTF% / Mini HTF% (min pole gain) | The pole gained at least this %. 80 = only poles of 80% or more. |

| Filter | What it does |
|---|---|
| IB (Inside Bar) | Today's candle sits inside yesterday's: high ≤ yesterday's high and low ≥ yesterday's low. |
| DIB (Double Inside Bar) | Two inside bars in a row: today inside yesterday, yesterday inside the day before. |
| NR7 | Today's range (high − low) is the smallest of the last 7 days. |
| MCP-D (Mother Candle Pattern) | After one large "mother" candle, at least 3 candles stayed inside its high–low (looked for over the last 60 days). |
| VCP | Volatility Contraction Pattern: each pullback in the base is smaller than the last (3 to 6 of them), base no deeper than 45%, last pullback under 12%, price within 8% of the pivot and within 20% of the 52-week high. |
| ATR Tightness | The full range of the last 3 days is smaller than one day's ATR%, and the close is above the 50 EMA. |
| Gap Up | The stock opened with a gap up today. |

| Filter | What it does |
|---|---|
| Episodic Pivot | A big news-type move in the last 30 days that still holds. Gap EP: opened at least 2% above the previous high on 2× the 20-day average volume. Non-gap EP: closed 5%+ up on 3× volume, close in the top 40% of the day's range. |
| HL/TL BO | Higher-low / trendline breakout signal. |
| Launchpad | A mother candle pattern is active and the 10, 21 and 50 EMA all sit inside the mother candle's range: price coiled right on its averages. |
Swings use 5 candles on each side; highs and lows must differ by more than 1% to count. Pick one Trend and/or one Stage.
| Filter | What it does |
|---|---|
| Uptrend | Higher highs and higher lows, or a consolidation that started at a new high. Close must be above the 50 EMA. |
| Downtrend | Lower lows and lower highs, or a consolidation that started at a new low. Close below the 50 EMA. |
| Trending | Making HH-HL (or LL-LH) and not inside a consolidation. |
| Consolidating | Inside a zone made by the last two swing highs and lows (triangle, box or sideways), at most 20% wide, formed in the last 63 days. |
| Breakout | Closed above a consolidation zone in the last 5 sessions. |
| Breakdown | Closed below a consolidation zone in the last 5 sessions. |
| Filter | What it does |
|---|---|
| EMA10 / EMA21 / EMA50 | Price slipped below that EMA and closed back above it today (the reclaim). |
| Combo | The reclaim happened on more than one EMA together. |
| Pause | After the reclaim, price is resting in a tight base that is still running today. |
| Clean Pause | Stricter Pause: only the cleanest bases. |
| Pause days ≤ | Only pauses up to this many sessions long. Empty = any length. |
| Filter | What it does |
|---|---|
| Daily PullBack | After a swing of at least 10%, price pulled back 5%+ and is now touching or bouncing off the 10 or 21 EMA. Needs 10 and 21 EMA above a rising 50 EMA, close above the 21 EMA, MACD above its signal and a candle under 6% range. |
| Weekly PullBack | A clean weekly rally of 30%+ (3 to 26 weeks), then a pullback that touched the 10- or 30-week EMA in the last 2 weeks. |
| Monthly PullBack | The same pullback logic on monthly candles, near the monthly EMA. |
A resistance line is built from swing highs (9 candles each side) that price has not closed above yet; highs within 2% of each other form one level.
| Filter | What it does |
|---|---|
| Near HLR | Price is just under the level: within 1.5× ATR%, capped at 4%. |
| Consolidating HLR | Near HLR, and the last 3 days' range is smaller than one ATR. |
| HLR BO | Closed above the level today. |
| 2+ Touch / 3+ Touch | The level was hit by at least 2 / 3 swing highs: a stronger line. |
Works on open gap-downs: days that opened below the previous low and have not been closed back above.
| Filter | What it does |
|---|---|
| Near Gap | Price is within 5% of the gap zone. |
| Consolidating Gap | Near Gap today and for each of the last 5 closes. |
| Gap Filled | Closed above the top of the gap today. |

| Filter | What it does |
|---|---|
| Bulls Snort | Volume at least 2× the 20-day average, close up on the day, and close in the top 35% of the day's range. |
| Vol Footprint | Today is the highest volume of the month, quarter or year (or 5× average), and a near-record volume day (≥ 95% of the 1-year high) happened in the last 21 sessions. |
| HVM / HVQ / HVY | Today's volume is the highest of the last month (21 sessions) / quarter (63) / year (252). |
| LMV / LQV / LYV | Today's volume is the lowest of the last month / quarter / year. |
| VD (Vol Dry) | Volume is under half of its 50-day average (20-day for newer stocks). |
| Vol Shocker | Volume at least 3× the average of the previous 20 sessions. |
These are values you type. Averages never include today.
| Filter | What it does |
|---|---|
| Volume ≥ / ≤ | Today's volume in shares. |
| Volume vs SMA | Today's volume as a multiple of its 20- or 50-day average. ≥ 1 = above average, ≥ 1.5 = spike, ≤ 0.5 = drying up. |
| Avg volume | 20- or 50-day average volume in shares, at least this much. A liquidity check that one spike can't fool. |
| Avg turnover (50D) ≥ | Average daily traded value over 50 days (avg volume × avg close), in ₹ crore. Stocks with less history use 20 days. |
| Day close | Up = closed above yesterday, Down = below. Use with a volume rule to tell buying volume from selling volume. |
Everything here uses completed weekly candles.

| Filter | What it does |
|---|---|
| WIB | Weekly Inside Bar: last week's candle sits inside the week before. |
| W-MCP | Mother candle pattern on weekly candles: later weeks stay inside one big week's range. |
| 3WTC | 3-Week Tight Close: the last 3 weekly closes are within 2% of each other. |
| Weekly HLR: Near / Consolidating / BO | The HLR rules on weekly candles: swing highs 3 weeks each side, highs within 2.5% form one level. Consolidating = last 3 weeks' range under one weekly ATR. BO = weekly close above the level. |
| Weekly Structure | Same Trend and Stage chips as daily, with swings of 3 weeks each side, the 30-week EMA, zones up to 35% wide and 26 weeks old. A breakout or breakdown counts this week or last week. |
| Base Pattern | Stocks in a weekly base. Set the minimum weeks in the base and the maximum depth %. |
| Stage 2 Base | A base inside a Stage 2 advance. Choose the condition (building, near breakout, breakout…) and limits: distance below the pivot, breakout within N days, base count, base weeks, base depth. |
| High Tight Flag | Weekly HTF with your own limits: minimum pole gain %, pole max weeks, flag max correction %, flag min and max weeks. |
Stan Weinstein's 4 stages on the weekly chart, using the 10- and 30-week EMA.

| Filter | What it does |
|---|---|
| 1 · Basing | Price moving sideways around a flat 30-week EMA after a decline. |
| 2 · Advancing | Price above 10-week EMA above 30-week EMA, and the 30-week EMA rising. Entering Stage 2 also needs a new 10-week swing high. |
| 3 · Topping | Sideways around a flat 30-week EMA after an advance. |
| 4 · Declining | Price below 10-week EMA below 30-week EMA, and the 30-week EMA falling. |
| Stage Changed | The stage changed this week. |
| Early Transition | A heads-up before the stage confirms: a Basing stock broke above its 26-week range (possible Stage 2), or a Topping stock broke below it (possible Stage 4). |
| Early Stage 2 | In a confirmed Stage 2 for 8 weeks or less: early in the advance. |
| Base Breakout | Stage 1 → 2 this week. |
| Topping Started | Stage 2 → 3. |
| Breakdown Confirmed | Stage 3 → 4. |
| Bottoming | Stage 4 → 1. |
| Failed Top | Stage 3 → back to 2. |
| Failed Base | Stage 1 → back to 4. |
The named changes only show if the previous stage lasted at least 3 weeks, so a one-week flicker gets no label.
Mark Minervini's trend template, all 8 points: close > 50 SMA > 150 SMA > 200 SMA, the 200 SMA higher than 25 sessions ago, close at least 30% above the 52-week low and within 25% of the 52-week high, RS Rating 70 or more.

| Filter | What it does |
|---|---|
| In Trend Template | Passes all 8 points today. |
| New Addition | Passes today but did not yesterday. |
| Dropped Today | Passed yesterday, fails today. |
Central Pivot Range from the period's high, low and close: Pivot = (H + L + C) / 3, BC = (H + L) / 2, TC = 2 × Pivot − BC. Current = levels for this week / month, from the last completed one. Developing = next period's levels, built from the current period so far.

| Filter | What it does |
|---|---|
| Position | Price Above TC, Inside the CPR, or Below BC. |
| Width | CPR width compared with ATR: Very Narrow (< 0.15 ATR), Narrow (< 0.30), Moderate (< 0.55). Narrow CPR often comes before a trending move. |
| Dev tighter than Current | The developing CPR is narrower than the current one. |

| Filter | What it does |
|---|---|
| Weekly EMA10 Tightness | Weekly candles in a narrow range close to the 10-week EMA over the lookback you pick. Set Max Range (% or in ATRs) and Max Distance from the EMA10 (% or in ATRs). |
| TTM Squeeze | Bollinger Bands (20, 2) are inside the Keltner Channel (20, 1.5 × ATR): volatility squeezed. Days ON = how many days in a row. |
| BB Squeeze | Bollinger Band width is 8% of price or less. Days ON = how many days in a row. |

| Filter | What it does |
|---|---|
| Daily / Weekly / Monthly RSI | 14-period RSI on that timeframe, above (>) or below (<) your number. > 60 = strong momentum, < 40 = weak. |
Each box takes a minimum (>=) and/or a maximum (<=), from the latest reported results.

| Filter | What it does |
|---|---|
| Sales% / EPS% / OPM% / PAT% | Growth in sales, EPS, operating margin and net profit, in %. |
| FCF/EBITDA | Free cash flow as a multiple of EBITDA: how much profit turns into cash. |
| Triple-digit Sales / EPS Growth | Growth of 100% or more. |
| P/E, P/B | Price to earnings, price to book. |
| ROCE, ROE | Return on capital employed, return on equity, in %. |
| D/E | Debt to equity ratio. |
| Promoter% / FII% / DII% | Holding of each group, in %. |
| Prom / FII / DII Trend | Holding rising or falling for the last 1, 2 or 3 quarters. |

| Filter | What it does |
|---|---|
| 1 / 3 / 6 / 12 Month ≥ | Price return over that many calendar months, at least this %. |
| RS Rating ≥ | Relative strength rank against all stocks, 1 to 99. 80 = beating 80% of the market. |
The RS line is the stock's price divided by an index. Pick the index first: Nifty 50, Nifty 500 or MidSml 400.

| Filter | What it does |
|---|---|
| RS New High (21d / 50d) | The RS line is at its highest of the last 21 / 50 days: the stock is beating the index. |
| RS Divergence (21d / 50d) | The RS line made that new high but the price did not. Often seen before the price follows. |

| Filter | What it does |
|---|---|
| Listed within | Listed in the last 1, 3, 6, 12 or 24 months, or your own number of months. |
| Listing Gain% Min | Gain on listing day at least this %. |

| Filter | What it does |
|---|---|
| 3DR% / 5DR% ≤ | (Highest high − lowest low) of the last 3 / 5 days, as % of price. Small = tight. |
| MSwing > 0 | Short-term momentum score from the 20- and 50-day returns; above 0 = rising. |
| MSwing > MSwing Avg (9D) | Momentum is above its own 9-day average: picking up. |
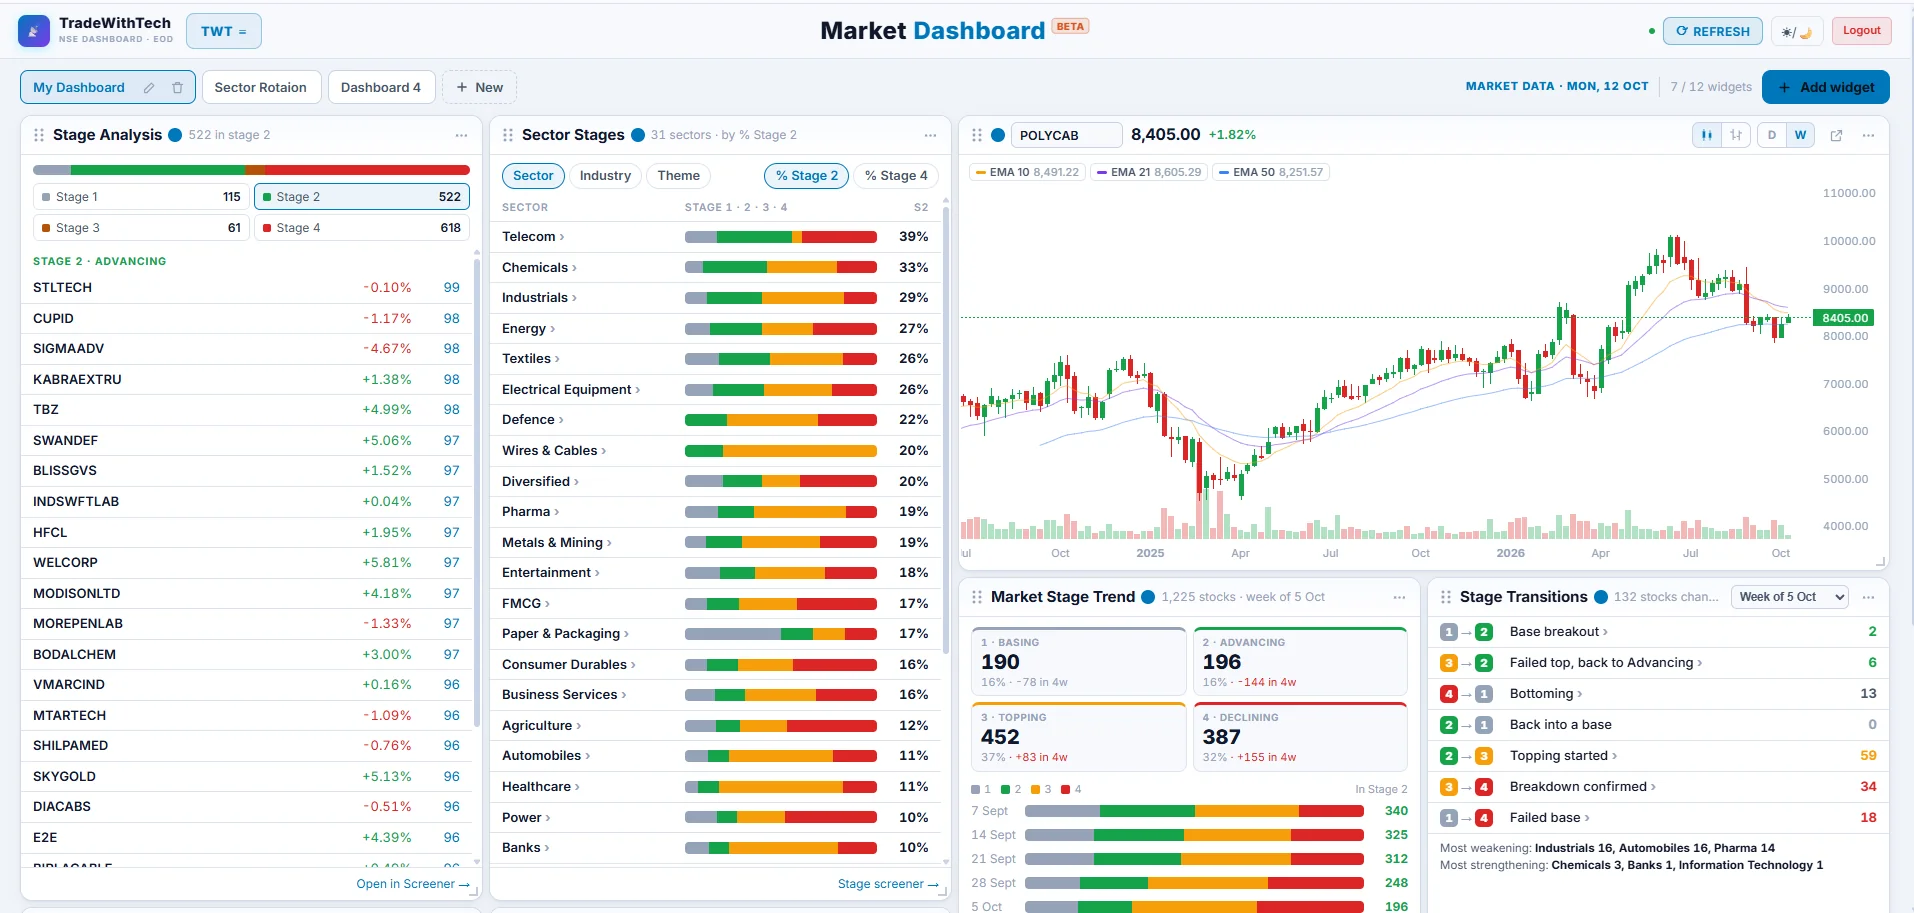
The first time you open it, you get My Dashboard already filled from the Swing Trader template, so there is something useful on screen straight away. Change anything you like; the layout is saved to your account and follows you to any computer.
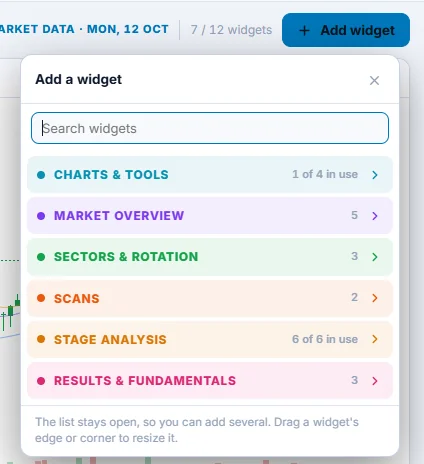
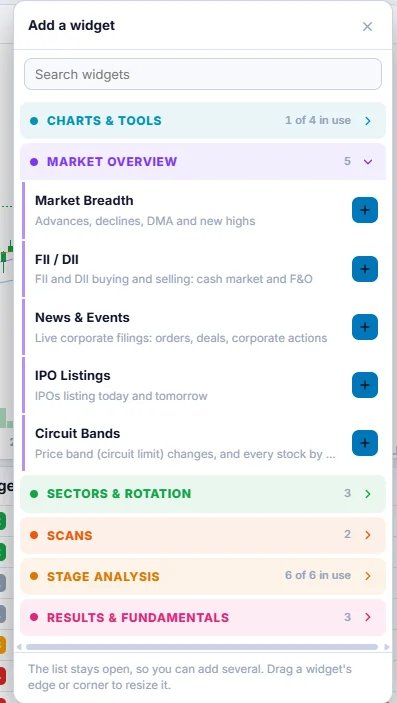
Click + Add widget. Widgets are grouped (Charts & tools, Market overview, Sectors & rotation, Scans, Stage analysis, Results & fundamentals) and there is a search box. The list stays open, so you can add several in a row. A dashboard holds up to 12 widgets; the counter next to the button shows how many you have.
Drag a widget by its ⠿ handle to move it. Drag its right edge, bottom edge or bottom-right corner to resize it. Widgets show more as they grow: a small one shows the key numbers, a large one adds columns, periods and charts.
Open a widget's ⋯ menu and pick a Link group colour (Cyan, Orange, Violet, or Not linked). Widgets with the same colour follow each other's stock: click a stock in 52W Highs and the Chart and Quarterly Results in that colour switch to it. The coloured dot in each widget header shows its group. The same menu has Duplicate and Remove.
Each dashboard is a tab at the top. Click + New next to the tabs, name the dashboard, and start blank or from a template — for example one for the morning scan, one for results season, one for the weekly review. Use ✎ to rename a tab and 🗑 to delete it.
⟳ REFRESH fetches the latest data for every widget. The date next to the toolbar shows which market day the data is from, and the dot beside Refresh is green when the data is current, yellow when it is a few days old and red if it could not load.
26 widgets in six groups, the same groups you see in the Add widget list.
| Widget | What it shows |
|---|---|
| Chart | Candlestick or bar chart of any stock, daily or weekly, with EMA lines (click a line's chip to hide it). The ↗ button opens the full chart. |
| Mini Screener | Stocks matching one of your saved screener presets, without opening the Screener. |
| Watchlist | Your starred stocks with price and change. |
| Position Size | Quantity to buy from your capital, risk % and stop loss. |
| Widget | What it shows |
|---|---|
| Market Breadth | Advances and declines, % of stocks above their moving averages, new highs. |
| FII / DII | FII and DII buying and selling, cash market and F&O. |
| News & Events | Live corporate filings: orders, deals, corporate actions. Click one to open the filing. |
| IPO Listings | IPOs listing today and tomorrow, with subscription and listing gain. |
| Circuit Bands | Price band (circuit limit) changes, and every stock by band. |
| Widget | What it shows |
|---|---|
| Performance | Sector, industry, theme and index returns for 1D, 1W, 1M, 6M or 1Y. Click a group to see its stocks; ‹ Back returns to the list. |
| Sector Moves | Sectors up and down today. |
| Industry Ranks | Industry groups ranked by relative strength. |
| Widget | What it shows |
|---|---|
| 52W Highs | Stocks at a new 52-week high today. |
| Volume Shockers | Volume far above the 20-day average. |
| Widget | What it shows |
|---|---|
| Stage Analysis | How many stocks sit in each Weinstein stage. |
| Market Stage Trend | The same count week by week, to see the market turning. |
| Sector Stages | Stage mix of each sector, industry or theme; click one to see its stocks. |
| Stage Transitions | Stocks that changed stage this week: breakouts, tops, breakdowns. |
| Breakout Watch | Long Stage 1 bases near a breakout, and fresh Stage 2 breakouts. |
| Stage 2 Health | How old and how stretched Stage 2 stocks are; fresh and tight names. |
| Widget | What it shows |
|---|---|
| Quarterly Results | Sales, EPS and profit by quarter with YoY growth, for the linked stock. |
| Quarterly Trend | The linked stock's last 9 quarters as a chart: Sales and PAT bars, operating margin as a line, or EPS. Hover a bar for exact values. |
| Valuation Snapshot | The linked stock's P/E, P/B, ROE, ROCE, EBITDA margin and debt/equity, each next to its sector's median. Green = better than the sector, amber = pricier, red = weaker. |
| Results Scorecard | Best results this season: growth, turnarounds, margins, EPS acceleration, sectors. |
| Sector Fundamentals | Median P/E, ROE and latest-quarter sales and profit growth of every sector or industry. Click a column to sort, a sector to see its companies. |
| Results | Companies reporting results, from the result calendar. |
Pick one when you create a new dashboard; you can change everything afterwards.
| Template | What it puts on the screen |
|---|---|
| Swing Trader | Chart, 52W Highs, Volume Shockers, Industry Ranks, Sector Moves, Market Breadth, Results, News (the default first dashboard) |
| Multi-Timeframe | Daily and weekly chart of the same stock side by side, 52W Highs, Stage Analysis, Watchlist, Position Size |
| Chart Center | Sector Moves, Chart, 52W Highs, Volume Shockers, Results, IPO Listings, Market Breadth |
| Stage Analysis | Market Stage Trend, Sector Stages, Stage Transitions, Breakout Watch, Stage 2 Health, weekly chart |
| Events Day | News & Events, Results, IPO Listings, Sector Moves, 52W Highs, Volume Shockers, Chart |
- RS rating (per stock): a score from 1 to 99 that ranks a stock's price performance against every other stock. RS 85 means the stock has done better than about 85% of the market. It measures price strength only, not valuation or fundamentals.
- Avg RS (per group): the average RS rating of all stocks in a sector or industry. Above 60 = the group is beating the market; below 40 = lagging.
- RS90+, RS80+, RS70+: the share of a group's stocks rated at least 90, 80 or 70. This is breadth: Avg RS 60 with RS80+ of 35% has many leaders; the same Avg RS with RS80+ of 8% is carried by a few stocks.
- 20d momentum (20d Δ): how much the group's Avg RS changed over the last 20 trading days. Positive = getting stronger. A group with average RS but strong positive momentum is often an early leader.
The Sort dropdown decides what "strong" means everywhere on the page: the cards, the table, the trend chart and the Leading list all follow it.

Sectors / Industries switches between about 30 broad sectors and about 130 narrower industries. Start with sectors for the big picture, then switch to industries to find the exact pocket of strength.
| Sort by | What it ranks groups on | Use it to |
|---|---|---|
| Avg RS | Average RS rating of the group's stocks | See overall leadership (the default) |
| % Stocks ≥ RS | Share of stocks with RS at or above the number you type (default 70) | Find groups with many strong stocks, not just a high average |
| Near 52WH % | Share of stocks within X% of their 52-week high (X set by the 52WH slider) | Find groups setting up near highs |
| MSwing % | Share of stocks whose MSwing is above the MSwing slider value | Gauge how many stocks have upward momentum |
| Avg MSwing | Average MSwing of the group's stocks | Compare momentum strength between groups |
| 20d Momentum | Change in Avg RS over 20 trading days | Spot groups that are improving fastest |
| Performance | The group's price return over a chosen period | Rank groups by actual returns |
Sliders: the 52WH slider works only with Near 52WH %, and the MSwing slider only with MSwing %; each is greyed out for the other sorts.
Performance options: choosing Performance shows two more dropdowns.
- Period: 1, 3, 6 or 12 months.
- Method: how a group's return is worked out from its stocks. Median = the middle stock's return, ignoring a few extreme movers. Average = every stock weighted equally. Mcap wt = weighted by market cap, so large companies count more, like an index. If Median is high but Mcap wt is low, the small and mid caps are doing the work.

- Trend chart: starts with the top 5 groups for the current sort. Add or remove groups from the dropdown, and switch between daily and weekly points. A line rising steadily for weeks matters more than one sharp jump.
- Leading: the groups at the top of the current sort right now.
- Improving Fastest: the groups whose measure rose the most over the last 20 trading days. These are often next in line to lead.

A group in both lists, high and still rising, is the strongest signal on the page. A group high on Leading but negative on momentum is strong but losing steam.
Each card or table row is one group, sorted by the current Sort; click one to open that group's own page.

- Top line: the group's name and how many stocks it holds. Industry cards also show their parent sector.
- Big number: Avg RS, or the selected return when sorting by Performance. The coloured top edge gives the same verdict at a glance: green is strong, red is weak.
- 1M / 3M / 6M / 12M strip: the group's return over each period, using the current Method. The period you sorted by is highlighted.
- Bottom row: RS90 and RS80 (share of stocks rated 90+ and 80+), 52WH (share near the 52-week high), MSW (share with MSwing above the slider) and 20dΔ (momentum).
The table view shows the same numbers in columns: Stks, 1M, 3M, 6M, 12M, Avg RS, RS90%, RS80%, RS70%, 52WH%, MSW% and 20d Δ. Click a column header to sort by it. Use Columns to hide the ones you don't need; your choice is remembered.

What to look for: returns positive across all four periods mean a steady trend; 1M negative while 6M and 12M are strongly positive usually means a pause inside an uptrend, not a breakdown.
Clicking a group opens its own page: how strong is this group compared with the rest, and which of its stocks are doing the work.

- Header row: the group's size, its rank by Avg RS and by 12M return (for example #4/31), and its 20d momentum. "Returns as" switches the Method for every return on the page.
- Performance: the 1M, 3M, 6M and 12M return, each with its rank among all groups.
- Strength: Avg RS with its rank, RS90+, RS80+, RS70+ (with stock counts) and the 20d change.
- Chart, three tabs: RS trend (the group's Avg RS against the median of all groups, dashed), Return trend (rolling return against the all-group median; above the dashed line = beating the typical group), and % above EMA (share of stocks above their 21, 50 and 200-day EMA; all three rising together = a broad, healthy trend).
- Leaders and Laggards: the three best and three worst stocks by 12-month return.
- Breadth: share of stocks above the 21, 50 and 200 EMA, and share near the 52-week high.
- Industries (sector page only): each industry's returns, Avg RS and momentum. Click a row to filter the stock list; the ↗ button opens that industry's page.
- Stocks: every stock with price, 1D, 1M to 12M returns, RS, distance from 52-week high and MSwing. Search, sort, choose columns, tick stocks to copy them to TradingView or add them to a watchlist.

The screenshots use sample data, so names and numbers are only examples.
Work from the top down: market, then sector, then industry, then stock. About five minutes a day.
- Find the leaders. Sort by Avg RS in Sectors mode and note the top 5 to 8. Check Leading and Improving Fastest.
- Confirm with returns. Switch to Performance, 3M and 6M. A real leader ranks high on both RS and returns.
- Check breadth. Prefer groups where RS80+ is high and many stocks are near their 52-week high.
- Go one level down. Switch to Industries, or open a sector and look at its Industries table.
- Pick stocks. On the group's page, sort the stock list by RS and study the leaders close to their 52-week high.
- Watch for change. Recheck weekly. A leader whose 20d momentum turns negative and whose % above 21 EMA falls sharply is losing leadership.
Reading tips:
- Small groups (under about 10 stocks) can swing on one stock; give them less weight.
- When Median and Mcap wt returns differ a lot, a few large or a few small companies are driving the result.
- RS and returns describe what has already happened. Use them to choose where to look, then decide on each stock with your own setup and risk rules.
| Term | Meaning |
|---|---|
| RS rating | A stock's price strength vs. all stocks, 1 (weakest) to 99 (strongest) |
| Avg RS | Average RS rating of a group's stocks |
| RS90% / RS80% / RS70% | Share of a group's stocks rated at least 90 / 80 / 70 |
| 20d Δ | Change in the sorted measure over the last 20 trading days |
| 52WH% | Share of stocks within the slider's % of their 52-week high |
| From 52WH | How far a stock is below its 52-week high |
| MSwing | Per-stock momentum swing score; positive means upward momentum |
| MSW% | Share of stocks with MSwing above the slider value |
| EMA | Exponential moving average of price over 21, 50 or 200 days |
| Median / Average / Mcap wt | Middle stock's return / equal-weighted return / market-cap weighted return |
| Stks | Number of stocks in the group |
A Relative Rotation Graph — plots sectors (or a watchlist of stocks) on two axes: trend vs. the benchmark and momentum of that trend, with a fading tail showing recent movement. Four quadrants tell the rotation story at a glance:
Pick a watchlist of stocks (or use the default sector view) and a benchmark to compare against, then adjust the tail length (3–20 periods) to control how much rotation history the trail shows.
A different tool from RRG, not a replacement for it — this plots an asset's average historical return at every position in a repeating calendar cycle. Not a live price chart, and not a current-rotation view.
Select one or more stocks/sector indices, then choose a Cycle Type: Yearly Cycle (12 Monthly Slices), Yearly Cycle (52 Weekly Slices — the default), or Decade Cycle (10 Yearly Slices, needs 5+ distinct years of data to be meaningful).
Sequential Path (Chronological) — the default — draws the actual slice-to-slice path through calendar time as a fading trail with a bright ring at the most recent point. Historical Averages (Polygon) plots one point per slice (averaged across every year seen) connected into a closed shape.
The mid-way dashed ring is neutral (in line with the benchmark). Points pulled toward the center historically underperformed NIFTY 50 in that slice; points pushed toward the outer edge historically outperformed. Dashed segments or hollow dots mean that calendar slice has no real trading history yet in the current data window — never shown as a fake 0%.
Click any symbol in the screener results to open its chart. You can also use the search bar at the top to jump to any stock.
Toggle Daily, Weekly, or Monthly with D/W/M. Switch between Candle, Bar, and Line views, and between Regular, Log, or % price scale — all instantly applied, with your zoom position preserved.
Add or remove any number of moving averages with custom period, color, and opacity, choose EMA or SMA, and set per-timeframe visibility. The same panel controls volume and M-Swing pane colors and heights too.
Use the layout icons to switch between Single chart, Dual timeframe (e.g. Daily + Weekly side by side), Stock + Index, or a full-pane Index view. Drag the divider between panes to resize.
In Stock + Index or Index Only layout, the chart auto-detects the most relevant index for the stock — its sector index if it's a constituent, or its sector benchmark otherwise. Use AUTO to keep re-detecting per stock, or switch to LOCKED to pin one index and compare every stock against it. Use the search, ◀ ▶ navigation, or the NSE/BSE filter to pick a different index manually.
The drawing toolbar on the left supports trendlines, rays, channels, rectangles, fibonacci, and text — saved per stock and timeframe. Below the chart, the MSwing panel shows momentum direction: green = positive momentum building, red = momentum fading. The 9-day average line helps filter noise.
The Overview tab shows net buy/sell across all segments for each participant. A strongly positive FII number in cash segment = institutional accumulation.
Switch to Cash, Index Futures, or Options tabs to see segment-specific flows. Futures positioning often leads price by a few days.
Switch between 7D, 1M, 3M, or 6M to spot accumulation trends vs. daily noise.
Shows all IPOs with active bidding windows. Includes price band, subscription status, GMP if available, and direct link to the registrar's allotment page.
Plan ahead — see what's coming in the next few weeks with open/close dates and expected listing dates.
Listing gain, subscription multiple, and days since listing — useful for spotting post-listing momentum trades.
When a stock moves from BSE to NSE, it enters a much larger and more liquid market. Retail and institutional access expands overnight, often triggering a re-rating. These events are worth watching for liquidity-driven price discovery.
SME-listed companies that grow large enough can graduate to the NSE or BSE mainboard. This signals business scale-up and opens the door to institutional buying. Stocks often see renewed interest around the migration date as visibility increases.
When a company splits into separate entities (like the Vedanta demergers), each new stock appears here on its first trading day. Stocks listing on both exchanges the same day show both badges in a single row — so you never see duplicates.
Use the filter bar to show only BSE→NSE, SME→Mainboard, New NSE, or New BSE events. Combine with the time filter (7D, 1M, 3M) to focus on recent events.
The Days column shows how many days since the event. Fresh migrations (under 30 days) tend to have the most price action as the market discovers them.
Select stocks and use "Copy TV" to paste them directly into TradingView for chart analysis.

When all four lines rise together and stay high, it signals a broad, healthy market move with wide participation — not just a handful of large stocks pulling the index up.
If the 10/20 MA lines rise while the 50/200 MA lines lag behind, it suggests emerging short-term momentum that hasn't yet broadened into a durable trend.
Breadth pushing above the 80% line can flag an overextended, overbought market. Dropping below the 20% line can flag oversold conditions or capitulation — both zones are often watched for potential reversals.
When the 10/20 MA lines cross above the 50/200 MA lines, it can signal a shift from weak to strong breadth — and the reverse crossover can signal broad weakness setting in.

A run of green bars signals broad-based strength — a growing number of stocks are hitting fresh highs, which usually accompanies a healthy uptrend.
A run of red bars signals broad-based weakness — new lows are outpacing new highs, which often precedes or confirms a downtrend.
If the index keeps rising while Net HL bars shrink or turn red, it can flag a narrowing rally where fewer stocks are participating — a caution sign for trend durability.
Unusually large green or red spikes often mark short-term exhaustion points — sharp bursts of new highs or lows can precede a pause or reversal.

When FII and DII cash flows are positive together, it signals broad institutional buying from both domestic and foreign sides — usually a strong bullish confirmation.
DII buying often offsets FII selling (and vice versa) — this tug-of-war shows up as opposing bars while the Net line stays relatively flat.
The yellow Net line smooths out the daily push-pull between FII and DII, making the underlying trend in total institutional flow easier to track.