Trade Smarter.
Win Consistently 🚀
TradeWithTech — Built by traders, for traders
India's most complete trading system — scan stocks with proprietary signals, track sector strength and market breadth, chart with your own indicators, build strategies and custom indices, and journal every trade. All in one place.
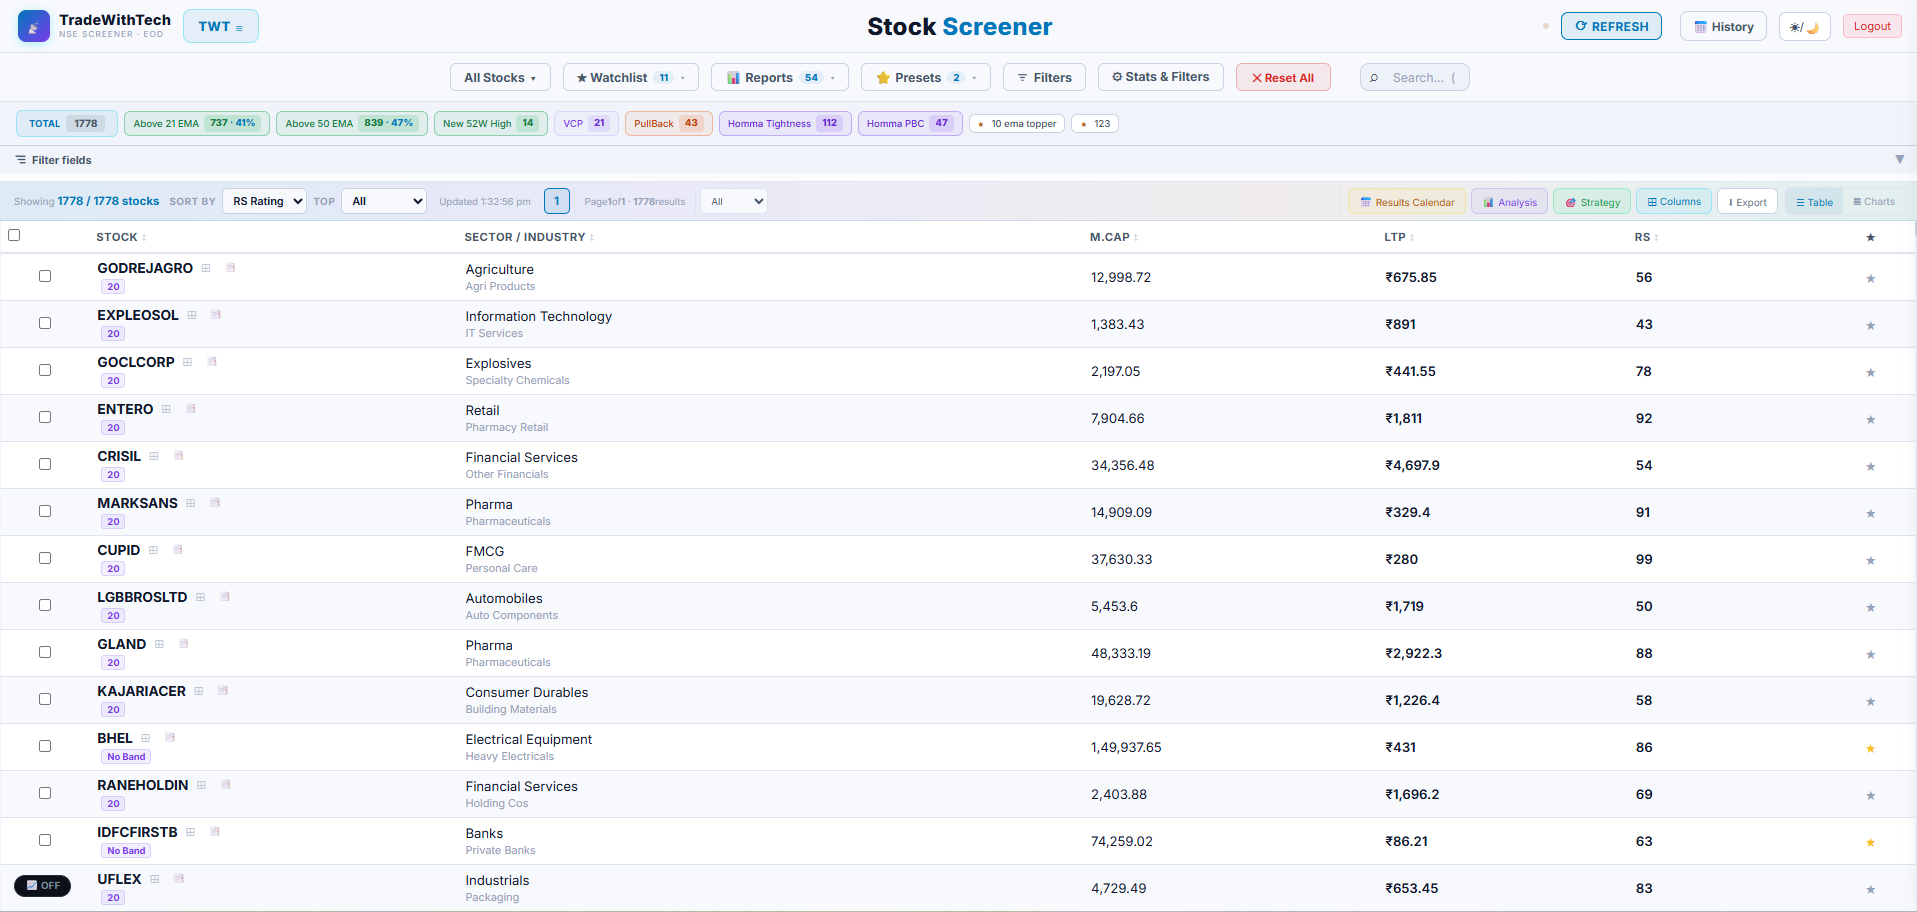
Scan NSE & BSE stocks by strength, setup and liquidity
Start from the whole market and narrow it down to the handful of names worth a closer look — leaders with high RS, clean setups and enough liquidity to trade.
- Ready-made scans: Launchpad, Episodic Pivot, Shakeout, Pullback, Inside Bar, 3-Week Tight Close, Near HLR, Gap Filling and more.
- Strength filters: RS Rating, MSwing, new 52-week highs and distance from the all-time high.
- Trend & liquidity: price vs 21 / 50 / 200 EMA, market cap, average turnover, RVOL, ATR% and delivery %.
- Slice the market: by sector, industry, F&O stocks, circuit band and result quarter.
See which sectors and industries are leading the market
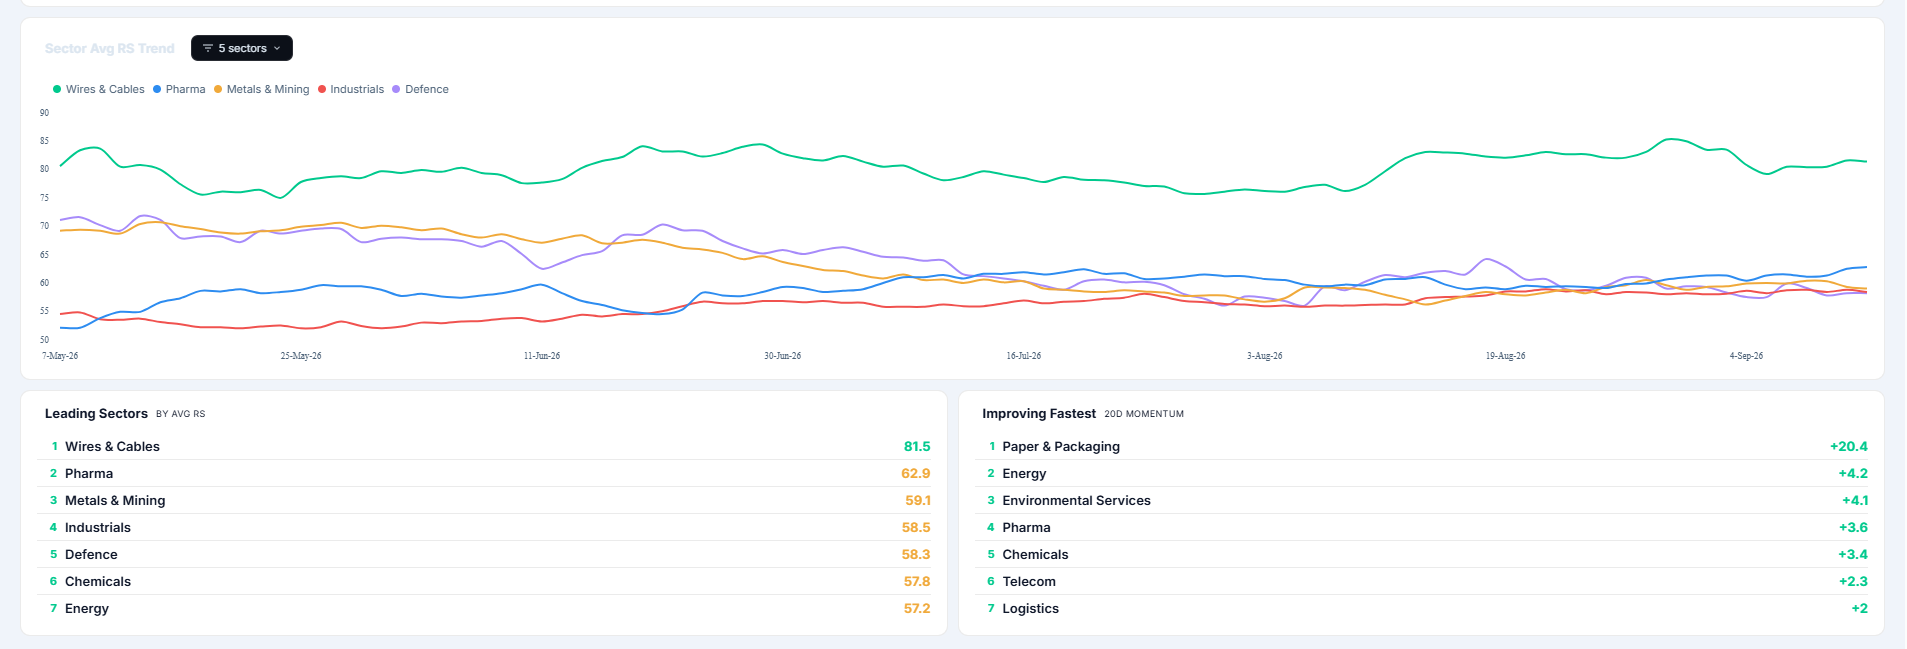
Money rotates. The RS Dashboard ranks sectors, industries and themes by the relative strength of the stocks inside them, so you can spot new leadership early and avoid groups that are fading.
- Sector & industry ranks: average RS, % of stocks above an RS level, % near 52-week highs and 20-day momentum.
- Leaders and risers: top sectors by average RS and the ones improving fastest.
- Relative Rotation Graph (RRG): each group placed in Leading, Weakening, Lagging or Improving.
- Seasonality: how sectors have tended to perform at this time of the year.
- Drill down: click a sector to see its industries and the strongest stocks in each.
Know whether the whole market is joining the move
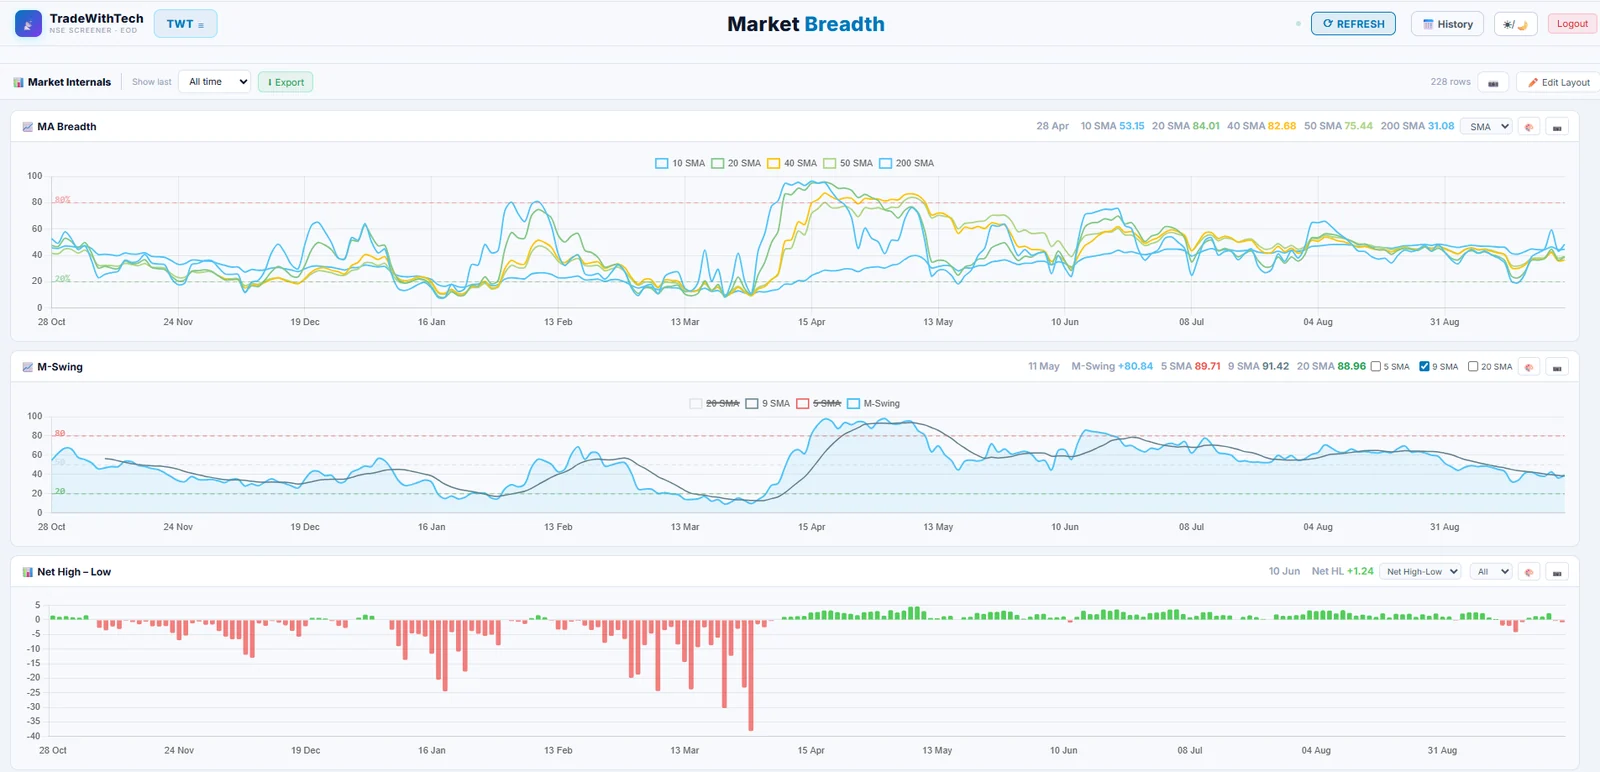
An index can rise on the back of a few heavyweights while most stocks fall. Market breadth counts how many stocks are actually in uptrends, so you can size up risk before you size up positions.
- MA breadth: % of stocks above their 10, 20, 40, 50 and 200-day moving averages (SMA or EMA), with 80% / 20% extreme zones.
- M-Swing breadth: market-wide momentum with 5 / 9 / 20-period smoothing to spot turns early.
- Net new highs – lows: see when new highs overpower new lows, or the other way round.
- History & layout: from the last 10 days to all-time, export the data and arrange the panels your way.
Fast, clean charts — with indicators you write yourself
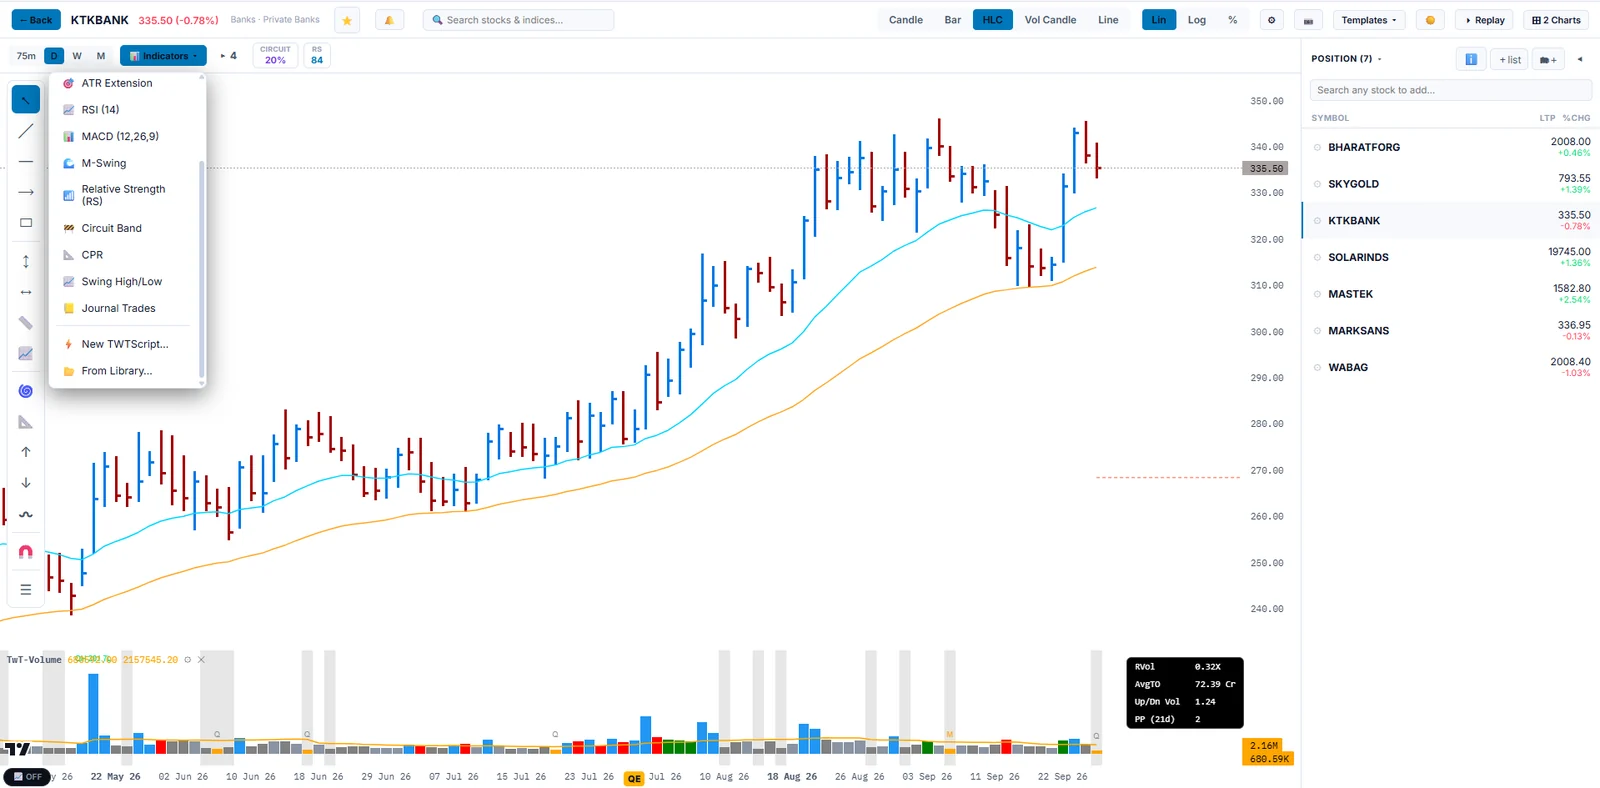
Every stock opens in a full charting view built for price action: smooth candles, volume and momentum panes, and the overlays swing traders actually use.
- Build your own indicators: create custom indicators with TWTScript, our simple scripting language with 25+ built-in functions — or pick one from the library. Save them to your account and share them with a link.
- Every timeframe & style: 75-minute, daily, weekly and monthly — as candles, bars, HLC, volume candles or line, on linear, log or % scale.
- Built-in indicators: RSI, MACD, M-Swing, Relative Strength, ATR Extension, CPR, Circuit Band and Swing High/Low — plus your own journal trades marked on the chart.
- Draw & review: trend lines, levels and measure tools, bar Replay to practise, and 2 charts side by side.
- Templates: save your chart setup once and get the same view on every stock.
Turn your trading idea into a scan — in plain English
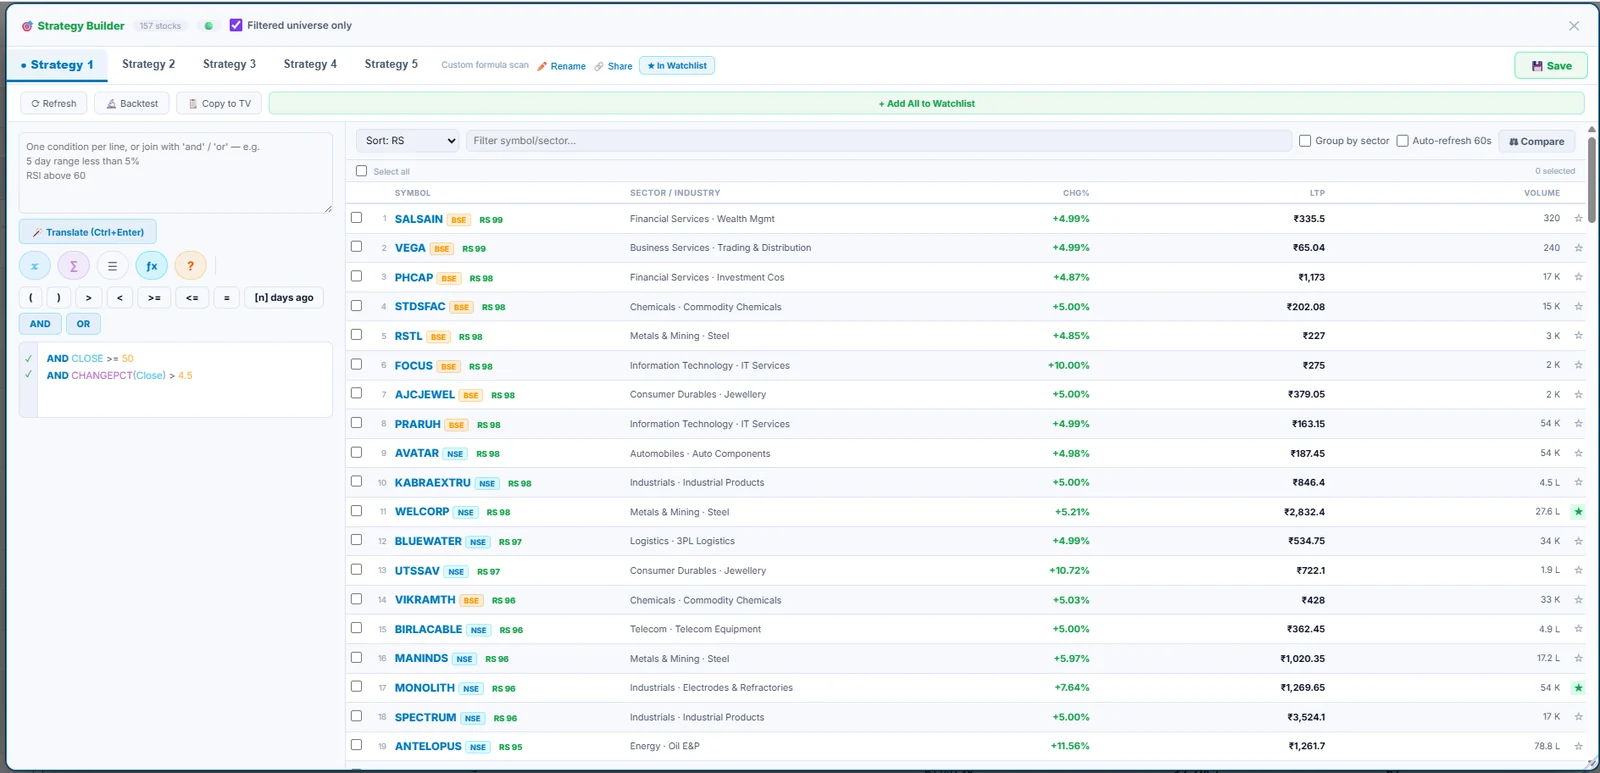
Describe the setup you look for, and the Strategy Builder turns it into rules the screener can run across the whole market. No coding needed.
- Plain-English conditions: one condition per line — like “5 day range less than 5%” or “RSI above 60” — and Translate turns it into a formula.
- Formula keypad: build rules from price, moving averages, volume and momentum with AND / OR, comparisons and “n days ago”.
- Daily & weekly: mix daily and weekly timeframe conditions in the same strategy.
- 5 strategy slots: save, rename and share your strategies, and run them on your filtered list or the whole market.
- Act on the results: sort by RS, group by sector, compare stocks, and add the whole list to a watchlist in one click.
Build your own index — and track it like the real thing
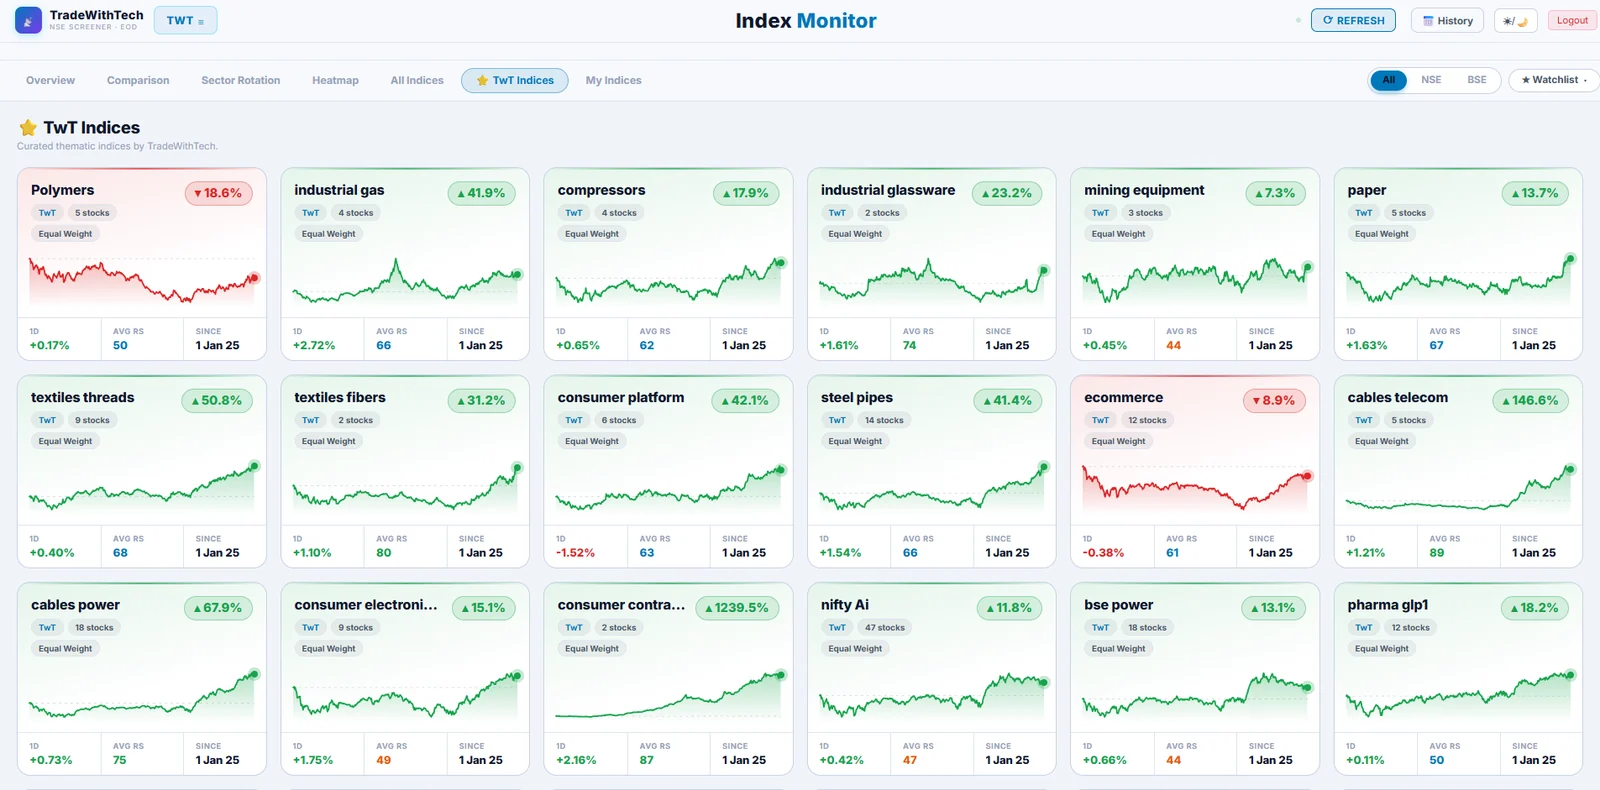
Group the stocks of a theme you follow into one basket and watch it as a single index, with its own candlestick chart, strength and momentum.
- Your basket, your weights: up to 50 stocks with equal, market-cap, RS-based or your own custom % weights.
- Honest history: adding or removing stocks only changes the index from that day on — past performance is never rewritten.
- Full chart view: candlesticks with Avg RS and Avg MSwing panes, and a benchmark overlay vs NIFTY 50, NIFTY 500 or NIFTY MidSmallcap 400.
- TwT Indices: ready-made thematic indices curated by our team — from cables and capital goods to hospitals and defence.
Everything around the trade
Research a stock, watch the market around it, and track how your trades actually played out.
Fundamentals & Research
Quarterly P&L, balance sheet, cash flow and shareholding trends for every stock, with a peer comparison table.
Market Internals
FII / DII flows, bulk & block deals, circuit bands and participant OI — the big picture before you pick a stock.
News & IPO Centre
Insider trades, corporate actions, IPOs and exchange announcements — tracked and surfaced as they are filed.
Trade Journal
Log every trade, then measure your real edge — win rate, expectancy, profit factor and drawdown over time.
Your daily trading workflow
Scan the Market
Apply filters across RS Rating, EP patterns, sector rotation and 50+ signals to find stocks matching your setup.
Execute & Journal
Take your trade, then log it with your size, risk and the reasoning behind it.
Review & Improve
Track win rate, expectancy and drawdown weekly. Double down on what works, cut what doesn't.
What traders are saying
"Overall a perfect tool/site for a Trader. Easy to operate man. Very clean UI. Definitely recommended to experience it once, u'll love it."
"Whatever you need, everything is here. Superb work."
"It's awesome 👍 It's for everyone whether swing, positional or long term investing. Comprehensive platform."
Free to start. Upgrade when you're ready
Screener stays free forever. Pro unlocks RS Dashboard, unlimited watchlists & presets, Charting overlays, Intraday Pulse, and more.
Frequently asked questions
What is the RS Rating on TradeWithTech?
RS Rating ranks every stock from 1 to 99 by its price performance against all other NSE and BSE stocks we track. A rating of 90 means the stock has outperformed about 90% of the market — leaders usually carry high RS before and during their biggest moves.
What does market breadth tell me?
Breadth shows how many stocks are taking part in a move. When the index rises but fewer stocks stay above their 50 or 200-day moving average, or new 52-week highs dry up, the rally is getting narrow. Rising breadth confirms a healthy trend.
Can I build my own index of stocks?
Yes. With Custom Index you pick up to 50 stocks, choose equal, market-cap, RS or custom weights, and track the basket like a real index with its own chart, average RS and MSwing. You can also follow ready-made TwT thematic indices.
Which exchanges does TradeWithTech cover?
TradeWithTech covers stocks listed on both NSE and BSE, with end-of-day data updated every trading day.
Is TradeWithTech free to use?
Yes — the screener is free forever. Pro unlocks the RS Dashboard, unlimited watchlists and presets, charting overlays, custom indices and more.
Ready to trade with an edge?
Join traders using TradeWithTech to make faster, smarter, data-driven decisions every single day.